
In the meeting, I had prepared a presentation to assess the progress that we had made as a community of mathematical scientists in UPM, particularly with reference to INSPEM. I was trying to move away from the position of only responding to the pressure of external factors of restructuring and high KPIs, which are not in our control, to a position of where we as a community of mathematical scientists would want to go amidst constraints. I had spent long hours on the presentation, thinking of what to say. But when it was presented, I didn't get to say as much as I wanted to say. So perhaps this post is to make up what I have missed.
I began with our recent QS subject rankings. Now I know there is this love-hate relationship between academics and rankings and some even spoke of ignoring rankings altogether. I do not subscribe to this view. Some go on to mock by taking a single datum, make singular comparison and confusing different datasets (between individual and organizational achievements) altogether. I prefer to approach the matter as a scientist by viewing the rankings are simply datasets and there is valuable information that comes with them. A single datum does not mean much but better information can be gotten when this is seen in a bigger context within one dataset or even correlating them with another dataset. I do agree however, rankings are open to abuse (as much as anything else) and administrators begin to become obsessive about them. But we should separate this form of poor judgement from seeking valuable information from the rankings (and yes, it takes effort to uncover useful information).
I have mentioned in the last post that UPM was ranked 201-250 for the subject of mathematics in 2019 along with UKM and UTM. I am pretty sure some of those who attended the meeting do not know about this. But what perhaps even more not known that we were also ranked 201-250 in the year before (at least I do not know it myself until I start to check this recently).

Perhaps what I wanted to point out is that we did not quite care about this before because of the different context we are experiencing and because of our own apathy. We are made aware of the ranking this year because of two things: the imminent threat of restructuring and the fact that there was a social media announcement that took the length of even reporting the top 300 and top 400 subjects being ranked in the university but mathematics was not mentioned. In other words, if we do not look for this piece of information, we will remain oblivious about the matter. Now our own 201-250 ranking information does not mean much but the fact that we are in the same bracket as UKM and UTM while UM and USM ranked above us, does mean something. It will be more meaningful if we look deeper into the ranking scores.

What we could see that our ranking relied mostly through our academic reputation, which we have build over the years. The things we need to further improve on are our citations per paper and the h-index scores. When I say improve, I don't mean manipulatively but more from the intrinsic value of each of our publication. As I said, one can make use of this ranking information to help us progress better in mathematics rather than being apathetic or even emotional about it. I also took the trouble of looking at the ranking of materials science in UPM (251-300) due to many of our university researchers are in this area. The scores reveal the opposite from that of mathematics; here the researchers need to work on the academic reputation as the citations per paper score is the highest among the Malaysian universities.
QS subject ranking relied more on citations. With growing concern of our increased KPI, the publication volume dataset will be another relevant source of information that we can look to. Note however, that larger number of scientific publications does not necessarily entail better scientific progress but may only increase its probability of being so. Let me show the UPM total math publication again from the last post.

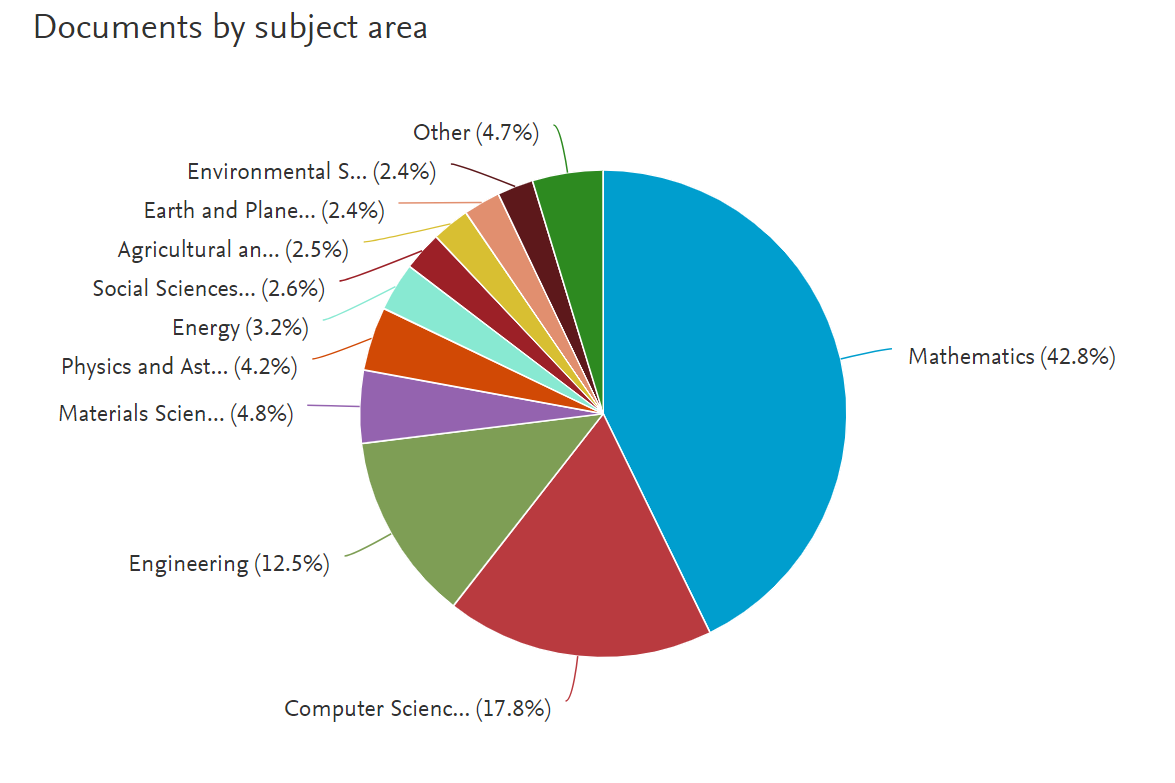
One can see clearly the steep increase of mathematics publications is after the declaration of research university status. It must be noted however, that not all of these publications come from mathematics department or the institute. Other entities also contribute to this volume of publications. The breakdown can be seen from the following piechart.
It should be interesting also to compare the mathematics publication output of the other research universities with that of UPM. To do this, we limit the period of publications to only the last five years (2014-2018), so that each dataset is comparable to the other. This is shown below.

Apart from UKM, all the research universities (including UPM) follow the same trend and hence can be attributed to some conditions happening at the national level. This is particular the case for the dip in mathematics publications for last year (2018) and hence UPM's decrease in mathematics 2018 publications must not be seen in isolation. The UKM case seems to be anomalous but the dip in 2016 seems to be present also in UM, USM and UTM.
Let us go back to the mathematics publications of UPM. Do INSPEM contributions follow the same trend as UPM? Below we show the mathematics publications for the period of 2003-2019 (to coincide with INSPEMs) followed by INSPEM's own mathematics publications. (Please ignore the last data point since this only represents the publication volume for the first three months of 2019.)


INSPEM publications (the second one) do not follow closely the curve for UPM (the top one) but there is a similarity in trend. The dip in 2014 for UPM is shown in INSPEM as a decreasing trend and this decreasing trend on average continues. One can also see that the decrease in publications in 2018 is seen in both UPM and INSPEM. Hence decrease in 2018 INSPEM publications can be attributed to something that happens at the university level or even at the national level (referring to the earlier diagrams for all RUs). Let us do a more quantitative comparison by listing the fraction of UPM mathematics publications that come from INSPEM (see below).

Note that from 2010-2014, INSPEM' s contribution is always above 50% (apart from 2011). From 2015 onwards, it fell below 50% which is worrying. The year 2015 was the year before our second director took over from the first and I can only remember this was the period when we had much reduced budget and even lost some contract staff. Nevertheless, such decreasing trend should send us warning signals that we need to rectify the situation. Perhaps the university's insistence for higher KPIs will help, though my personal humble opinion that this should be done with care. As I have once said that the usual response to a threat is fight or flight. It would be much better that if the administrators can convince all researchers of the need to address the problem and by them owning up this problem, there will be a better working and research environment and hence help the university reach its desired targets. Again numbers are just numbers and they are only meaningful if there is indeed a genuine scientific progress made in the research ecosystem.
I ended the presentation with the same subject bubble plot that I have shown in my last post. The basic idea is to further refine the Malaysian mathematics publication analysis right down to the subfields within mathematics. The plot consists of a vertical axis of cites per document which shows the intrinsic (average) citation that a subfield has, while the horizontal axis is its (extrinsic) h-index whose value are determined by citations across a history of documents. Bubbles of each subfield are plotted in this parameter space with the size of the bubble is determined by the number of publications in the subfield for the considered period. In a way, these gives us an idea of how each subfield is trending in Malaysia. I gave both plots of the 2013-2014 period (five years ago) and the 2017-2018 period (last year). This is shown respectively below as the first one and the second one.


As clearly shown above, mathematics research is very dynamical. Let me take the example of mathematical physics, the field that I am in. In 2013-2014 diagram (the first one), it is represented by the bubble next to analysis. It has about 6 cites per document and the h-index of about 22 (taken from 33 documents). In 2017-2018, the cites per document is reduced to about 0.9 but h-index remains about 22 for mathematical physics. As stated earlier, the absolute values themselves may not mean much but the relative position in the parameter space reveals perhaps much more meaning. For mathematical physics, the intrinsic cites per document became the highest in mathematics but its h-index remains modest relative to other fields. The subject with the highest h-index is Modeling and Simulation (the bubble besides Applied Mathematics) with the value of 55. Its cites per document (about 0.4) is relatively high than most other subjects but is still much lower than Mathematical Physics.
Perhaps another important point that can be drawn by the diagram is that even the subfields of mathematics shows variations of citation culture, even within mathematics itself. It will probably be of no surprise if one is to plot the bubble diagram for the whole of science, one can see much more variation in the citation culture. I did not show such diagram in my presentation but below I give it for Malaysian publications in the period of 2017-2018.

One can see that mathematics citation culture is among the lowest of all the sciences. The other lower subjects (the bubbles to the left under mathematics) are Economics, Econometrics & Finance and Arts & Humanities. It is perhaps no wonder that researchers among the social sciences often felt underappreciated when they are being compared to the other sciences. But such feeling can be extended to the subject of mathematics itself. It is best that university administrators understand this cultural difference in citations among the different sciences or even more generally the cultural difference in research among the different sciences.
On the next day after the institute meeting, I met the former director who actually founded INSPEM to relay to him about our current worries. I can see his disappointment about the imminent changes to the institute. He mentioned his wishes that we (me and the management) will be able to carry INSPEM through in the future. I left his room with the feeling of a heavy burden on my shoulders. After coming back home from work, I had another spike in my blood pressure and hence rested thereafter. My nap was shortened as my mind went through many scenarios and having thoughts of this particular post. So how should we do the plot of the endgame?
No comments:
Post a Comment